Supply
Bismuth — Mining, Supply & Dilution
This page provides a clear overview of how Bismuth emits new coins, how supply evolves over time, and how the protocol has changed across several hard forks.
Four different graphs visualize the emission schedule from complementary perspectives:
- Total Supply Over Time
- Rewards Per Category (PoW / Dev / Hypernode)
- Mining Rewards Per Block
- Annual Dilution
A short explanation accompanies each graph for technical/ non-technical readers.
1. Total Bismuth Supply Over Time
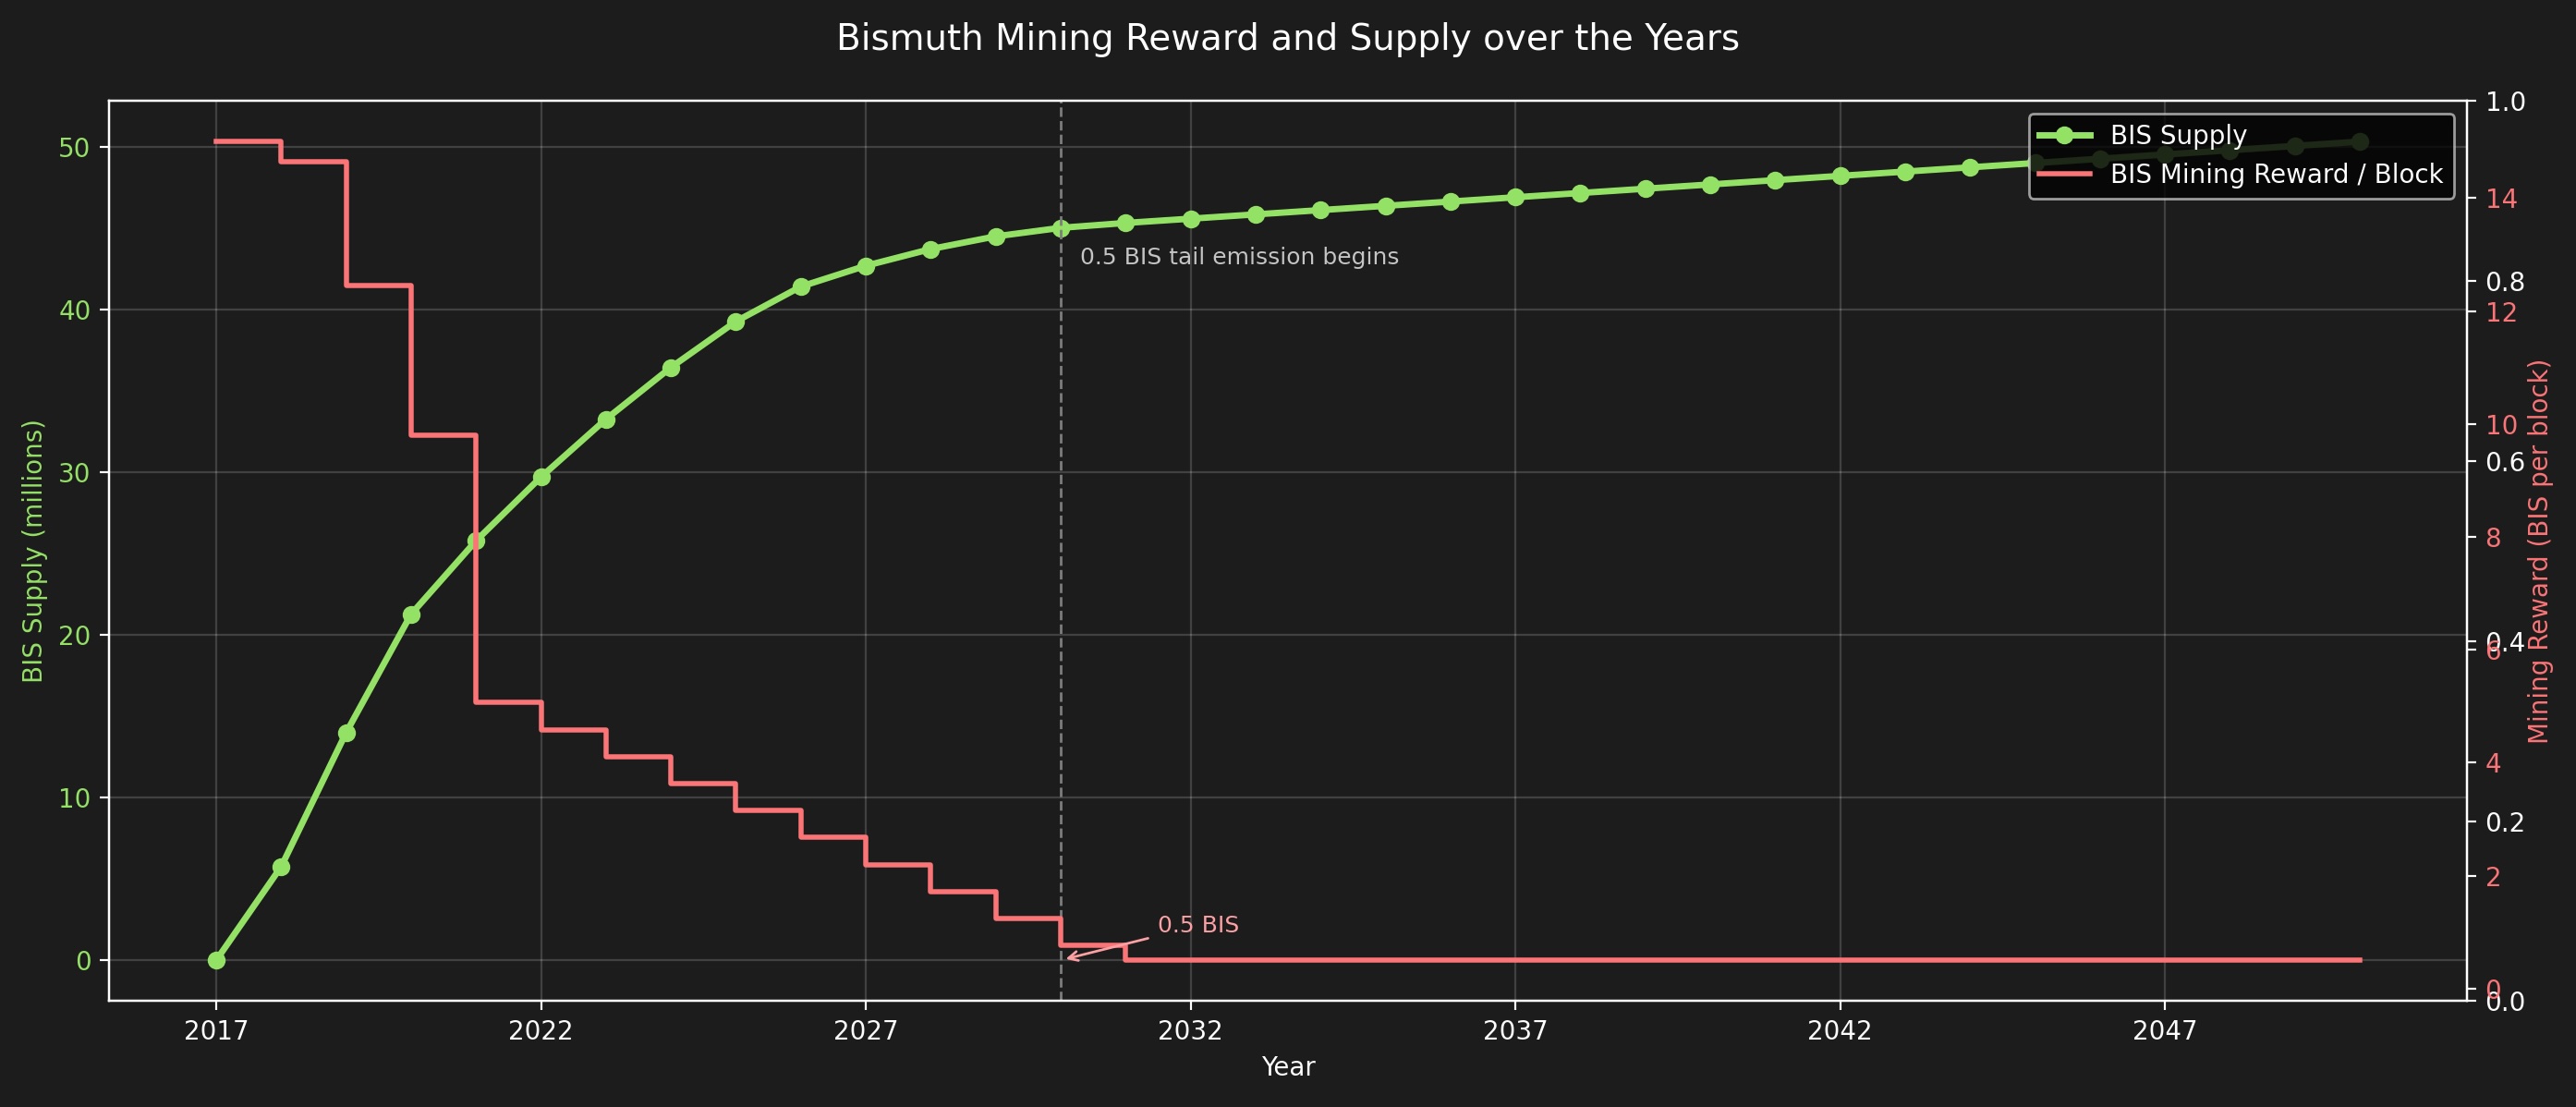
This graph shows:
- The cumulative circulating supply of BIS from the genesis block (May 1st, 2017) to the far future.
- All supply components: PoW mining, Dev rewards (10% of miner rewards), and PoS/Hypernode payouts (until 2025).
- Major emission phases and hard forks.
- Estimated dates when future block heights will be reached (10M, 20M, 30M blocks…).
Purpose: To give a birds-eye view of how BIS supply grows under the emission schedule, including slope changes after each emission fork.
Why it matters: Investors and node operators can understand long-term inflation, block reward decay, and supply trajectory.
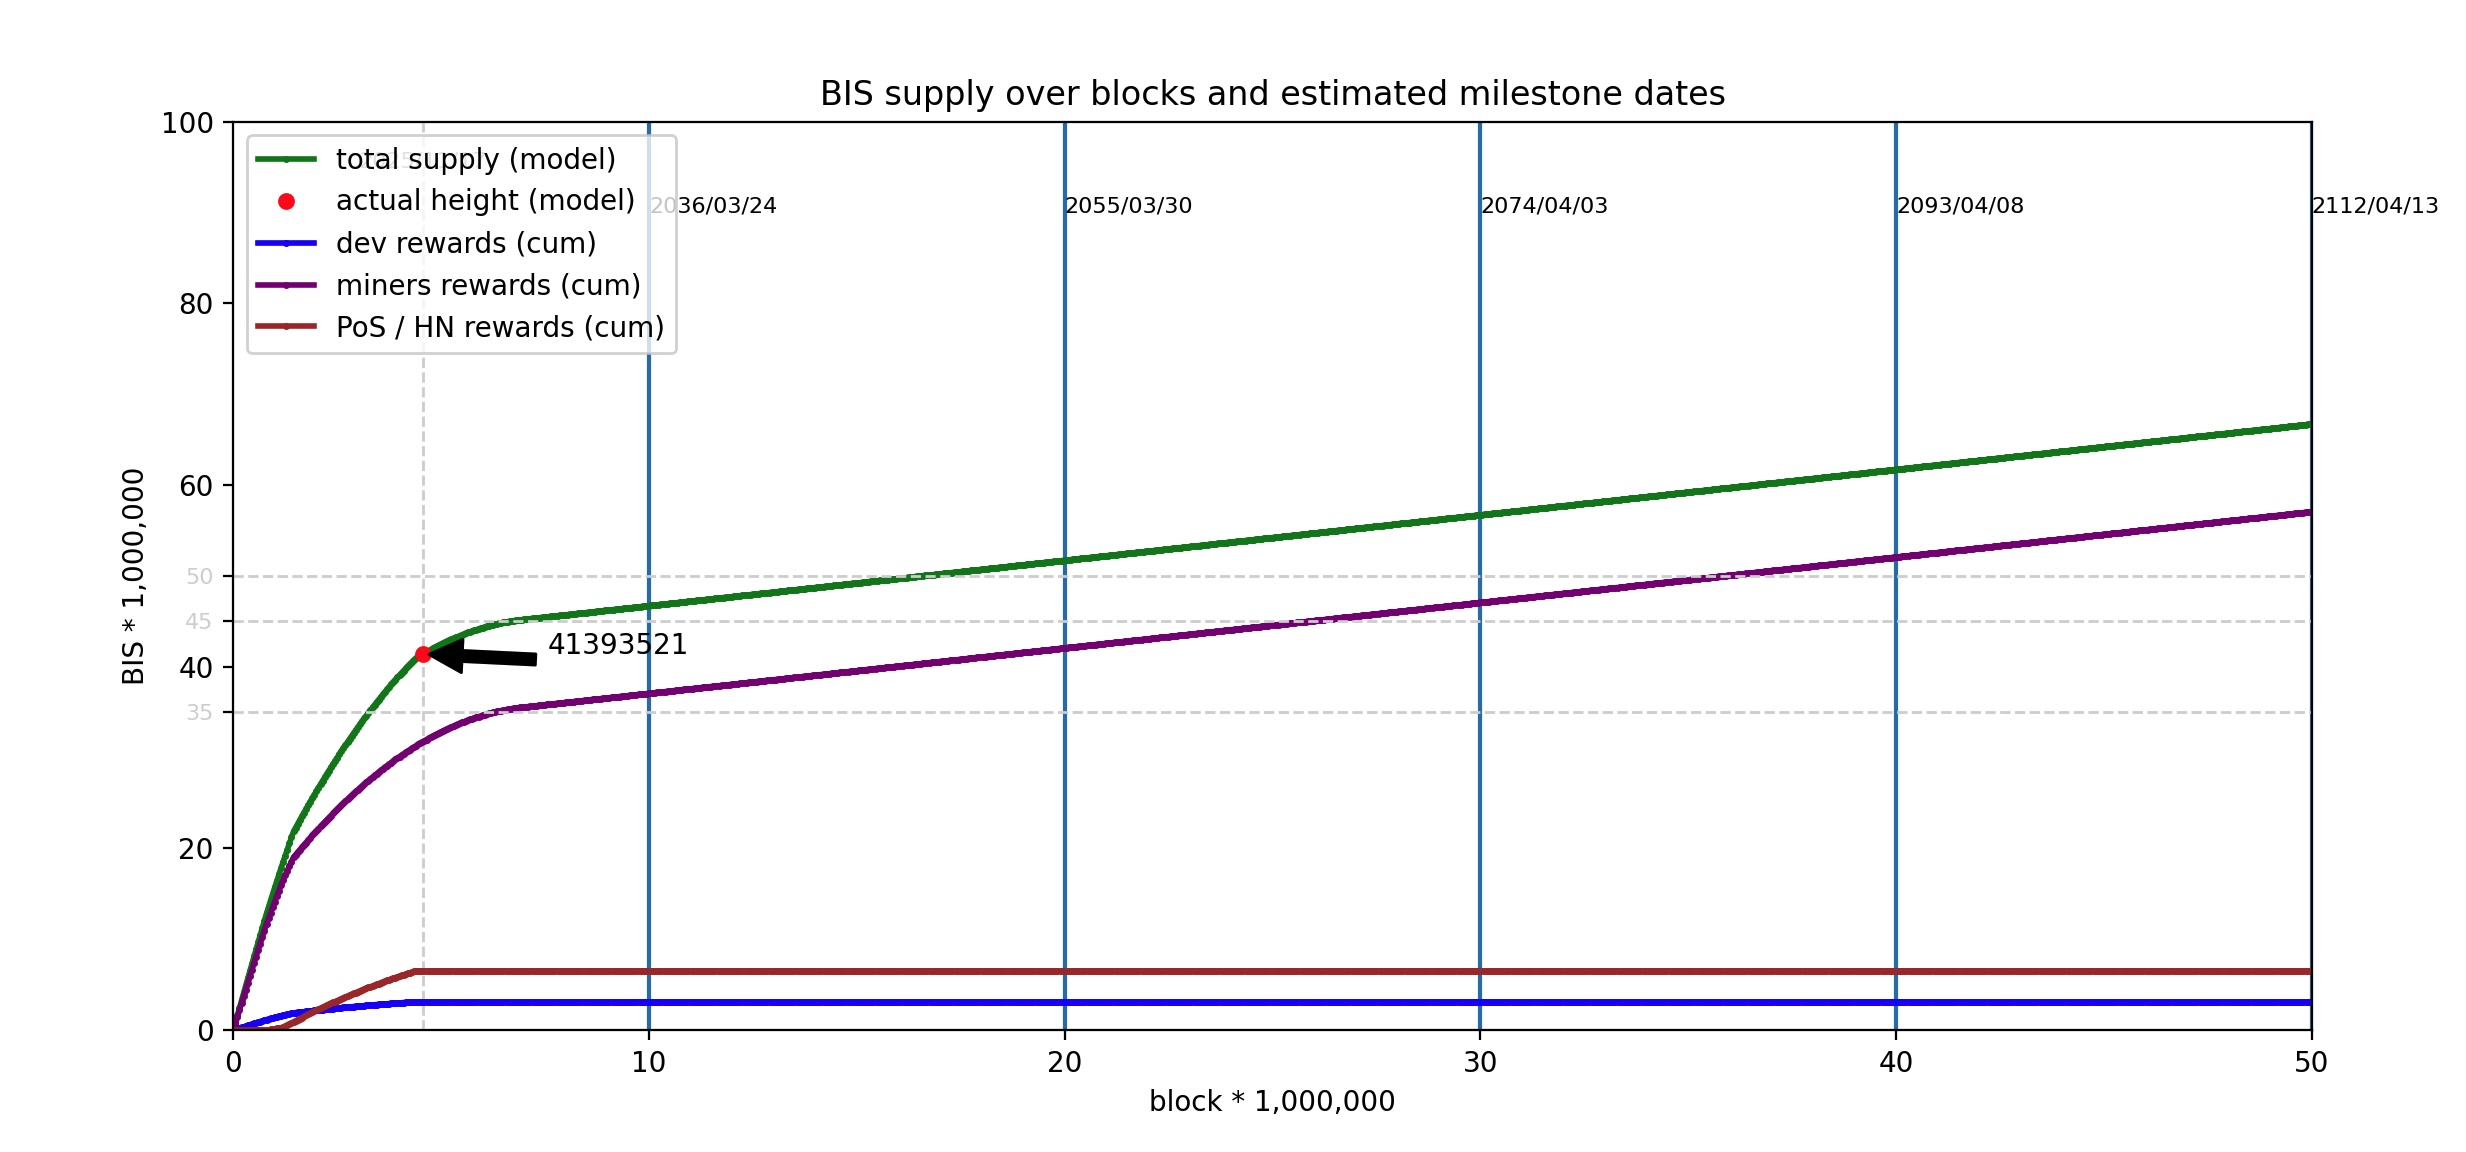
2. Rewards Per Category (PoW / Dev / Hypernode)
This graph visualizes cumulative supply added by each reward type:
- PoW Mining rewards
- Dev rewards
- Hypernode (PoS) rewards
It shows clearly:
- When PoS/Hypernode payouts were introduced (Block 800,000).
- When distributions changed (Block 1.2M, Block 1.45M).
- The sharp flattening after Block 4,380,000 where PoS and Dev rewards ended permanently.
Purpose: To understand where new BIS coins came from, historically and conceptually.
Why it matters: It clarifies supply composition and helps users verify soft-fork/hard-fork effects.
Interpreting the Dev & PoS Lines After Block 4,380,000
The graph shows the following three cumulative totals:
- rewards_miners — Cumulative miner (PoW) rewards
- rewards_dev — Cumulative Dev rewards (10% of miner)
- rewards_pos — Cumulative PoS / Hypernode rewards
From the graph alone, it may look like Dev and PoS rewards continue to exist beyond block 4,380,000 (the soft-fork height). But this is not the case.
What the graph is actually showing:
These lines represent total historical supply accumulated from each reward type. Once Dev + PoS rewards stop at block 4,380,000, their curves become completely flat, they no longer increase.
In other words:
- Dev supply minted so far remains constant.
- Hypernode (PoS) supply minted so far also remains constant.
- Only miner rewards continue increasing supply after HF4.
This is a normal behavior for cumulative-sum graphs. To avoid confusion, the labels and explanation make it clear that:
“Flat line means no new rewards.”
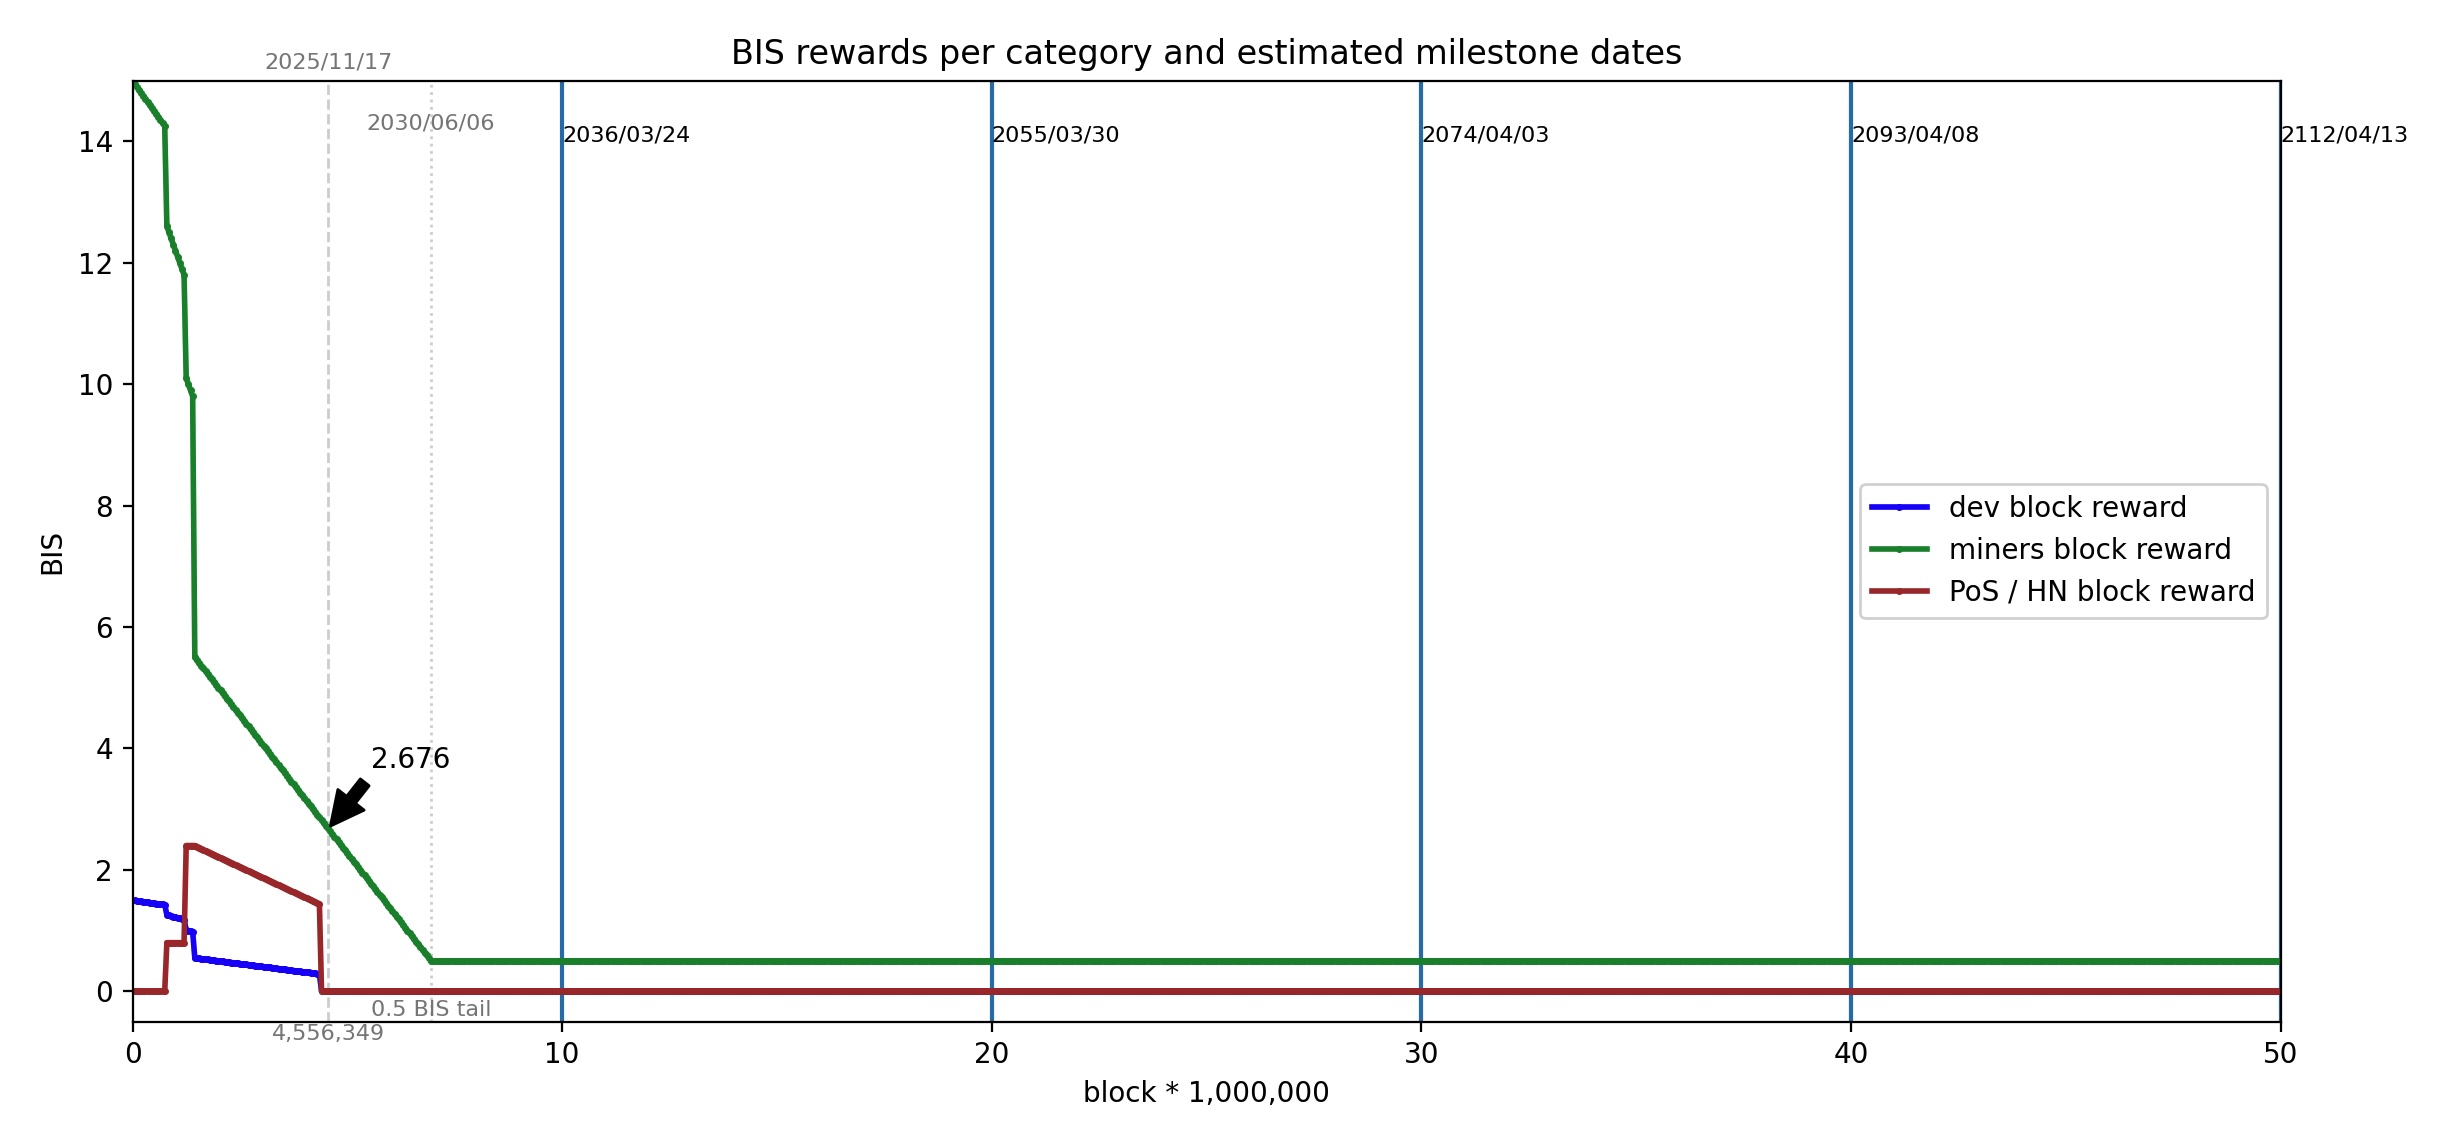
3. Mining Rewards Per Block
This graph displays the per-block reward schedule:
- PoW miner reward
- Dev reward
- PoS/Hypernode reward
You also see:
- The progressive decay of mining rewards.
- The exact point and date when Dev/PoS rewards dropped to zero.
- The long-term stable tail emission (0.5 BIS/block).
- Today’s block height and today’s reward marked on the graph.
Purpose: To show the instantaneous emission rate per block, and how it changes over Bismuth’s lifetime.
Why it matters: Useful for miners, pool operators, emission analysts, and explorers.
4. Annual Dilution
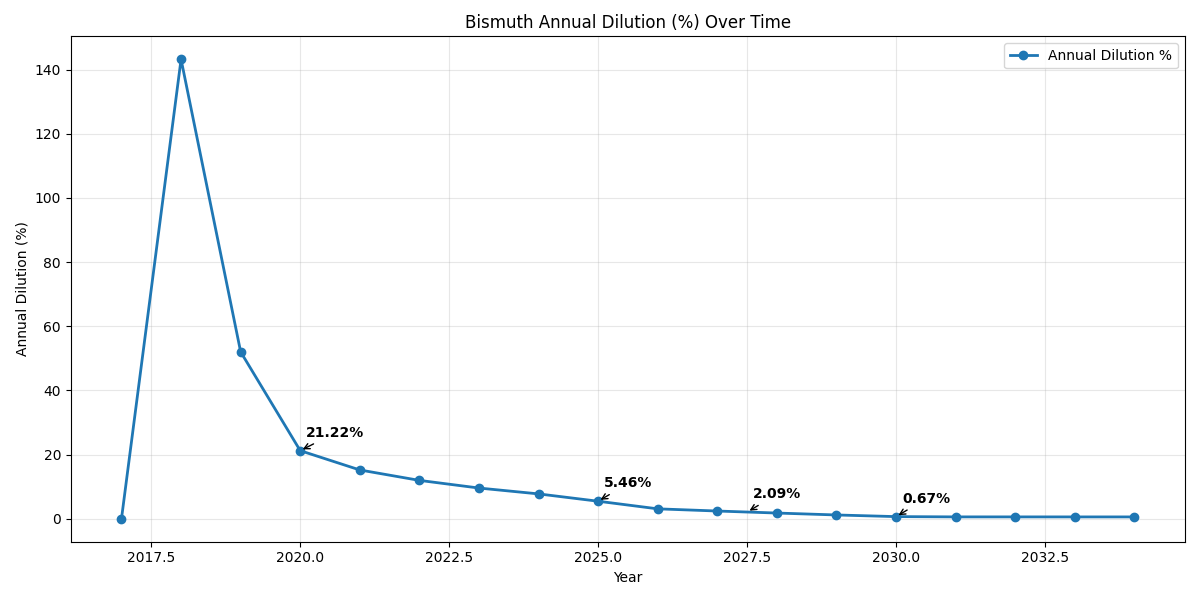
This graph (and CSV table) calculate Bismuth’s annual dilution rate, defined by:
New BIS minted during a calendar year divided by Total supply at the beginning of that year.
This uses precisely the same emission logic as the chain:
- No premine
- PoW transition phases (HF1 → HF3)
- Tail emission decay
- HF4 removal of Dev & HN rewards
- Decimal-accurate quantization (8 decimals)
Purpose: To show how inflation evolves year-by-year in economic terms.
Why it matters: Dilution is the best metric for understanding long-term monetary quality and supply dilution, much more meaningful than raw block rewards.
Bismuth Timeline
Below is a clear, concise timeline of only the forks that directly affect monetary policy. This avoids clutter while still informing the user.
Bismuth Monetary Policy Timeline
| Date | Block | Event |
|---|---|---|
| 2017/05/01 | 1 | Genesis Block — Pure PoW (no premine) |
| 2018/08/31 | 800,000 | HF1 — Introduction of Hypernodes / PoS sidechain |
| 2019/06/06 | 1,200,000 | HF2 — Emission slope adjustment |
| 2019/11/27 | 1,450,000 | HF3 — BGV-01 emission change |
| 2025/07/18 | 4,380,000 | HF4 Soft Fork — Removal of Dev & HN rewards (return to pure PoW) |
Notes
- Hypernodes remain functional but no longer receive block rewards after HF4.
- Dev reward (10% of PoW) also ends at HF4.
Development & Hypernode Reward Addresses (for verification) All historical Dev and PoS/Hypernode rewards were paid to fixed, public on-chain addresses.
Development Fund Address:
4edadac9093d9326ee4b17f869b14f1a2534f96f9c5d7b48dc9acaed
This address received 10% of the miner reward at each eligible block. After the soft fork at block 4,380,000, this address receives no further rewards.
Hypernode (PoS) Reward Address:
3e08b5538a4509d9daa99e01ca5912cda3e98a7f79ca01248c2bde16
This address collected all PoS / Hypernode payouts. After the soft fork, PoS/Hypernode rewards are discontinued, and this address receives nothing further.
Script Sources (Reproducible Graphs)
All graphs on this page are fully reproducible using open-source scripts:
| Graph | Script | Link |
|---|---|---|
| 1. Total Supply Over Time | supply_mining_plot.py | Total Supply |
| 2. Rewards per Category | supply_calc.py | Rewards per Category |
| 3. Supply Over Blocks | supply_calc.py | Supply over Blocks |
| 4. Annual Dilution | bismuth_dilution.py | Anual Dilution |